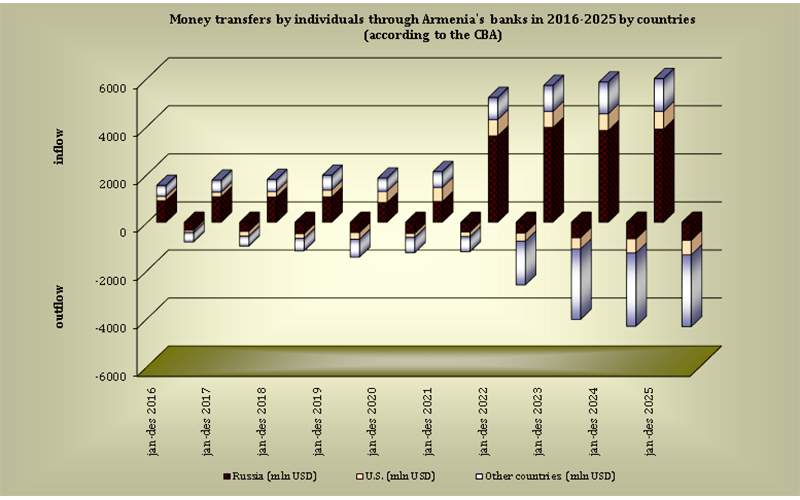


ArmInfo. The net inflow of private transfers to Armenia in January-December 2025 increased by 8.6% (compared to a 9% decline in 2024), exceeding $1.6 billion. Moreover, non-commercial transfers also experienced a positive trend, shifting from a 35% decline to a 25% increase, reaching $714.1 million in absolute terms. The share of the latter in the total net inflow rose from 38% to 44% over the year (compared to 53% in 2023 and 67% in 2022), as reported by the Central Bank of the Republic of Armenia.
The annual dynamics of transfers from all countries broken down by inflow and outflow, are as follows: inflow growth remained at 2.4%, while outflow slowed from 7% to a stagnant 0.3%. As a result, the inflow in January-December 2025 amounted to $5.98 billion (including $1.2 billion non-commercial), while outflow was $4.3 billion (including $452.8 million non-commercial). Moreover, non-commercial transfers reversed their inflow dynamics from a 23% decline to a 15% increase, while outflow growth accelerated from 1% to 3%.
Russia remains the top source of transfers to Armenia, with the United States in second place, the United Kingdom in third, Switzerland in fourth, and the UAE in fifth. Tthese countries are also among the top five destinations for remittances from Armenia with Russia claiming the top spot from the UAE, the United States in third place, Switzerland in fourth; and Spain in fifth. In 2024, the top five were led by Russia (by inflow) and the UAE (by outflow), while the top five included offshore destinations such as the Isle of Man and Monaco, replacing the UK (inflow) and Spain (outflow).
The inflow of remittances from Russia was $3.9 billion, while the outflow of remittances to Russia was $749.9 million. Moreover, the year-on-year dynamics of both indicators improved; in particular, the inflow of remittances from Russia increased from a 3.2% decline to a 1.5% increase, while the growth of the outflow of remittances to Russia accelerated from 7.3% to 9%. It's worth noting that that the inflow of non- commercial transfers in this direction increased significantly-by 36%-while the outflow grew more modestly-by 4%. This significantly slowed the decline in net inflows from 5.2% to 0.2%, maintaining their volume at $3.1 billion. However, the net inflow of non-commercial transfers jumped by 54% to $415.3 million. As a result, Russia's share of the inflow remained steady over the year-65%-while its share of the outflow increased slightly from 16% to 17%.
The inflow of transfers from the United States amounted to $733.8 million (including 45%, or $328.9 million, of non-commercial nature), while the outflow in this direction was $602.8 million (including over 11%, or $69.1 million, of non-commercial nature). Both indicators maintained growth, but inflows accelerated from 4% to 6.3%, while outflows slowed significantly from 26% to 3.1%. This resulted in a net inflow of transfers from the US of $131 million, up from a 47% decline to a 24% increase. As a result, the US share of both inflows and outflows remained unchanged over the year, at 12% and 14%, respectively.
The inflow of transfers from the UK amounted to $207.3 million (with annual growth accelerating from 44% to 89%), while the outflow in this direction was $163.6 million (with the annual dynamics returning from a 45% decline to 2.5% growth). This improved the dynamics of the net inflow of transfers from the UK from a 77% decline to a significant threefold increase, with the absolute value returning from negative to positive $43.7 million. Non-commercial transfers in this direction accounted for only 11-15%. As a result, the UK's share of inflows increased over the year from 2% to 3%, while in outflows it remained at 4%. The inflow of transfers from Switzerland exceeded $131.9 million (with the annual growth rate changing from an 11% decline to 5.1% growth), while the outflow amounted to $532.1 million (with the annual growth rate slowing from 93% to 17%). This increased the negative level of net transfer inflows from Switzerland by 21% annually to $400.2 million. Non-commercial transfers account for a paltry 5-2% of this flow. As a result, Switzerland's share of inflows remained at 2%, while its share of outflows increased from 11% to 12%.
The inflow of transfers from the UAE exceeded $105 million, but the outflow was more significant at $631.9 million. However, on an annual basis, both inflows and outflows shifted from 56-54% growth to a 10-28% decline, reducing the negative net inflow of transfers from the UAE by 31% to $526.9 million. Non-commercial transfers accounted for a low 10-2% of this total. As a result, the UAE's share of inflows remained at 2%, while its share of outflows decreased from 20% to 15%.
It should be noted that in 2024, the inflow of transfers to Armenia from all countries amounted to $5.8 billion (including $1.01 billion of non-commercial transfers), while the outflow amounted to $4.3 billion (including $440 million of non-commercial transfers). The former grew by 2.5% and the latter by 7.1%. As a result, the net inflow of private transfers to Armenia in 2024 decreased by 9%, totaling $1.5 billion. Moreover, for non-commercial transfers, the decline in net inflow was significant - decreasing by 35% to $573.5 million. The share of the latter in the total net inflow decreased from 53% to 38%. Russia's share in the inflow decreased from 69% to 65%, while remaining at 16% in the outflow. The UAE's share in the inflow is minimal - from 1.3% to 2%, while in the outflow it rose from 14% to 20%. The US share in the inflow remained at 12%, and in the outflow it increased from 12% to 14%.